| month | pageviews | |
|---|---|---|
| 0 | 1 | 150.75 |
| 1 | 2 | 82.50 |
| 2 | 3 | 160.00 |
What are the advantages of using code to do our daily data work? And what are we missing when we primarily do our data work by moving the mouse and clicking buttons on the screen?
Auditability and reproducibility
Once upon a time, you were in elementary school solving math problems. Your teacher didn’t really care how old Alice would be in five years, given that Bob, her brother who is half her age now, is six years old.
The important thing was the procedure. How did you get to the number 17? Can you systematically and consciously go through a set of steps to make sure that you have the correct answer?
Fast-forward to today, you are still solving similar data problems, much more complicated, and with real-life consequences. Do you know how to audit the steps you took, and can you be sure that your solutions are correct?
When you solve a data problem or answer a question with “point and click” tools, those mouse movements, clicks, and their sequence are not recorded anywhere. That labor evaporates the moment you are done with it. It seems convenient and easier, but when you come back to that spreadsheet with so many calculations all over the place, it’s difficult to trust those numbers. You make typos, don’t you?
When you do things with code on the other hand, all “work” is done by writing the commands, and the commands have to be in a certain sequence. This is conceptually the same as doing things manually, but with the commands recorded.
Creating a pivot table
Spreadsheet
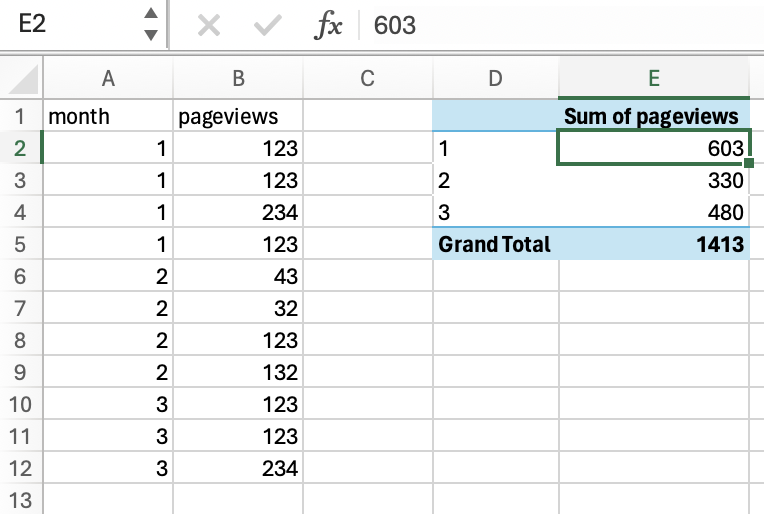
Looks great, but where do these numbers come from? Looking at the formula bar shows me the number, but not the calculation that produced it. I don’t know about you, but I make a lot of mistakes while working, I make typos, I hit some keyboard buttons by mistake, and make wrong decisions. So I need to be able to review my work, and make sure it’s correct.
There are ways to make work with spreadsheets reproducible if you are interested, and that would fall under working with code.
We can do the same thing with code, but instead of “doing” these steps, we write the commands in some programming language.
This is what the sequence of commands might look like in Python:
Python
- 1
- Load/activate the pandas library, (kind of like opening Excel)
- 2
-
Give the name
trafficto the table (this would be something likeA1:B12for example) - 3
- Create a pivot table using the specified columns
Now you can easily audit my work and see the exact commands that I wrote and check for yourself whether this is the correct thing to do or not. We can repeat the process many times, and make sure that given the same inputs and the same code, the result is always the same (reproducible).
Scaling
Now that we know that our procedure is correct, we can take the same three lines of code, and run them on any other file that contains the same traffic data (with the same columns). Those keystrokes on the keyboard can easily be saved to a text file, and reused millions of times.
- Horizontal scaling : Using the same tool on the same inputs again and again can be thought of as scaling things horizontally.
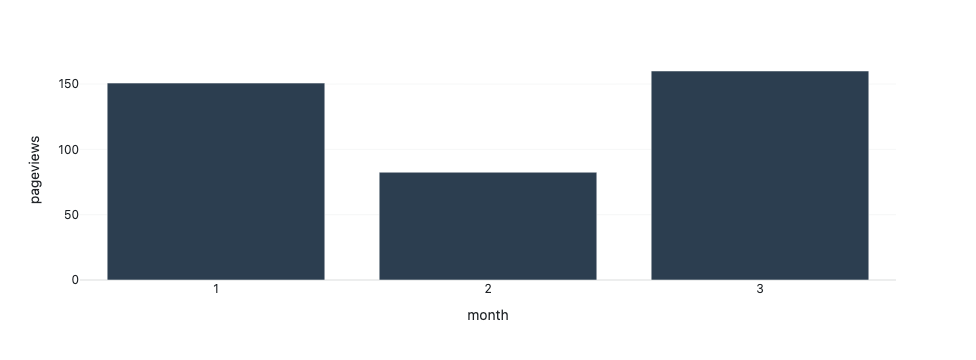
- Vertical scaling : Once we’ve run the same code on many similar files and are confident that it scales horizontally, it’s now time to add more code, and make it do more. After creating the pivot table we could create a chart for example, plotting months on the X axis and total pageviews on the Y axis
The pivot table:
We now have a program with five lines of code that we can test horizontally on a big set of files and make sure that it scales properly. We then scale vertically again, and so on.
Typically such programs have hundreds (if not thousands) of lines of codes. Having everything written down in the correct sequence gives us the cofidence that even if something is wrong, we can always find the mistake, improve, and build upon it.
Automation and packaging
Yes, we can go further.
We worked a lot on producing those five lines of code, checked on many datasets, received feedback, and are confident with this sequence of commands. We can now package this sequence of steps into a named function, something like analyze_traffic(filename). Now, instead of working with all those lines, we simply run this newly-created function, which would be added to our workspace. Functions can be bundled together in packages (or libraries), hosted on a package reposity (app store), and shared with anyone in the world. Those users would only use the newly-created commands without having to worry about the details of how they were created.
Again, many of these things can be accomplished with spreadsheets, but that would also fall under working with code in a reproducible and auditable way.
Conclusion
Working with code provides us with the confidence that our work is correct (or at least auditable). Once established, we can stop worrying about typos and syntax, and focus more on the strtegic issues and the decisions we want to make. This confidence gives us the ability to scale our work and reuse it many times. It allows others to build on our work, instead of reinventing the wheel every time. Also, many aspects of this approach can be done with spreadsheets, but it has to be done by writing code.